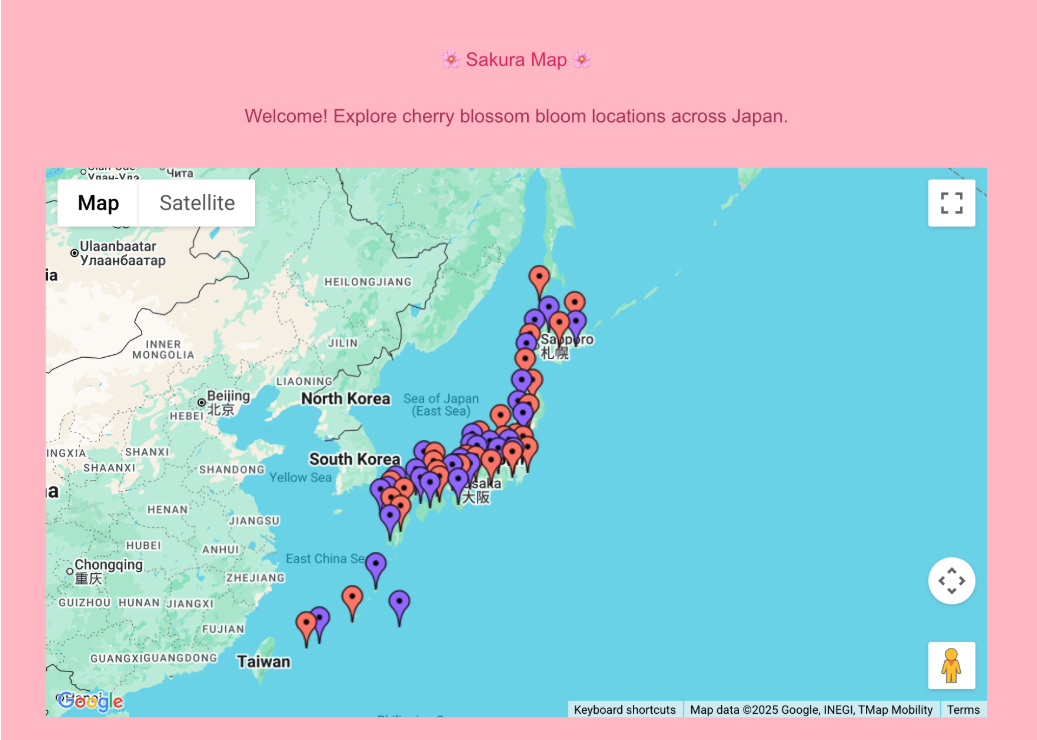
Analyzing Sakura bloom trends in Japan
Our projects attempt to Visualize Cherry Blossom Bloom Trends Across Japan by training a machine learning model on sakura flower bloom reccords and real geospacial NASA termperature and precipitation data. This project was done for the 2026 NASA Space Apps Hackathon. More information about the hackathon submission can be found on our github (button below).

Motivation
Japan attracts an average of 30–40 million tourists each year [1], many drawn by the country’s breathtaking natural scenery and particularly beautiful annual cherry blossom bloom.
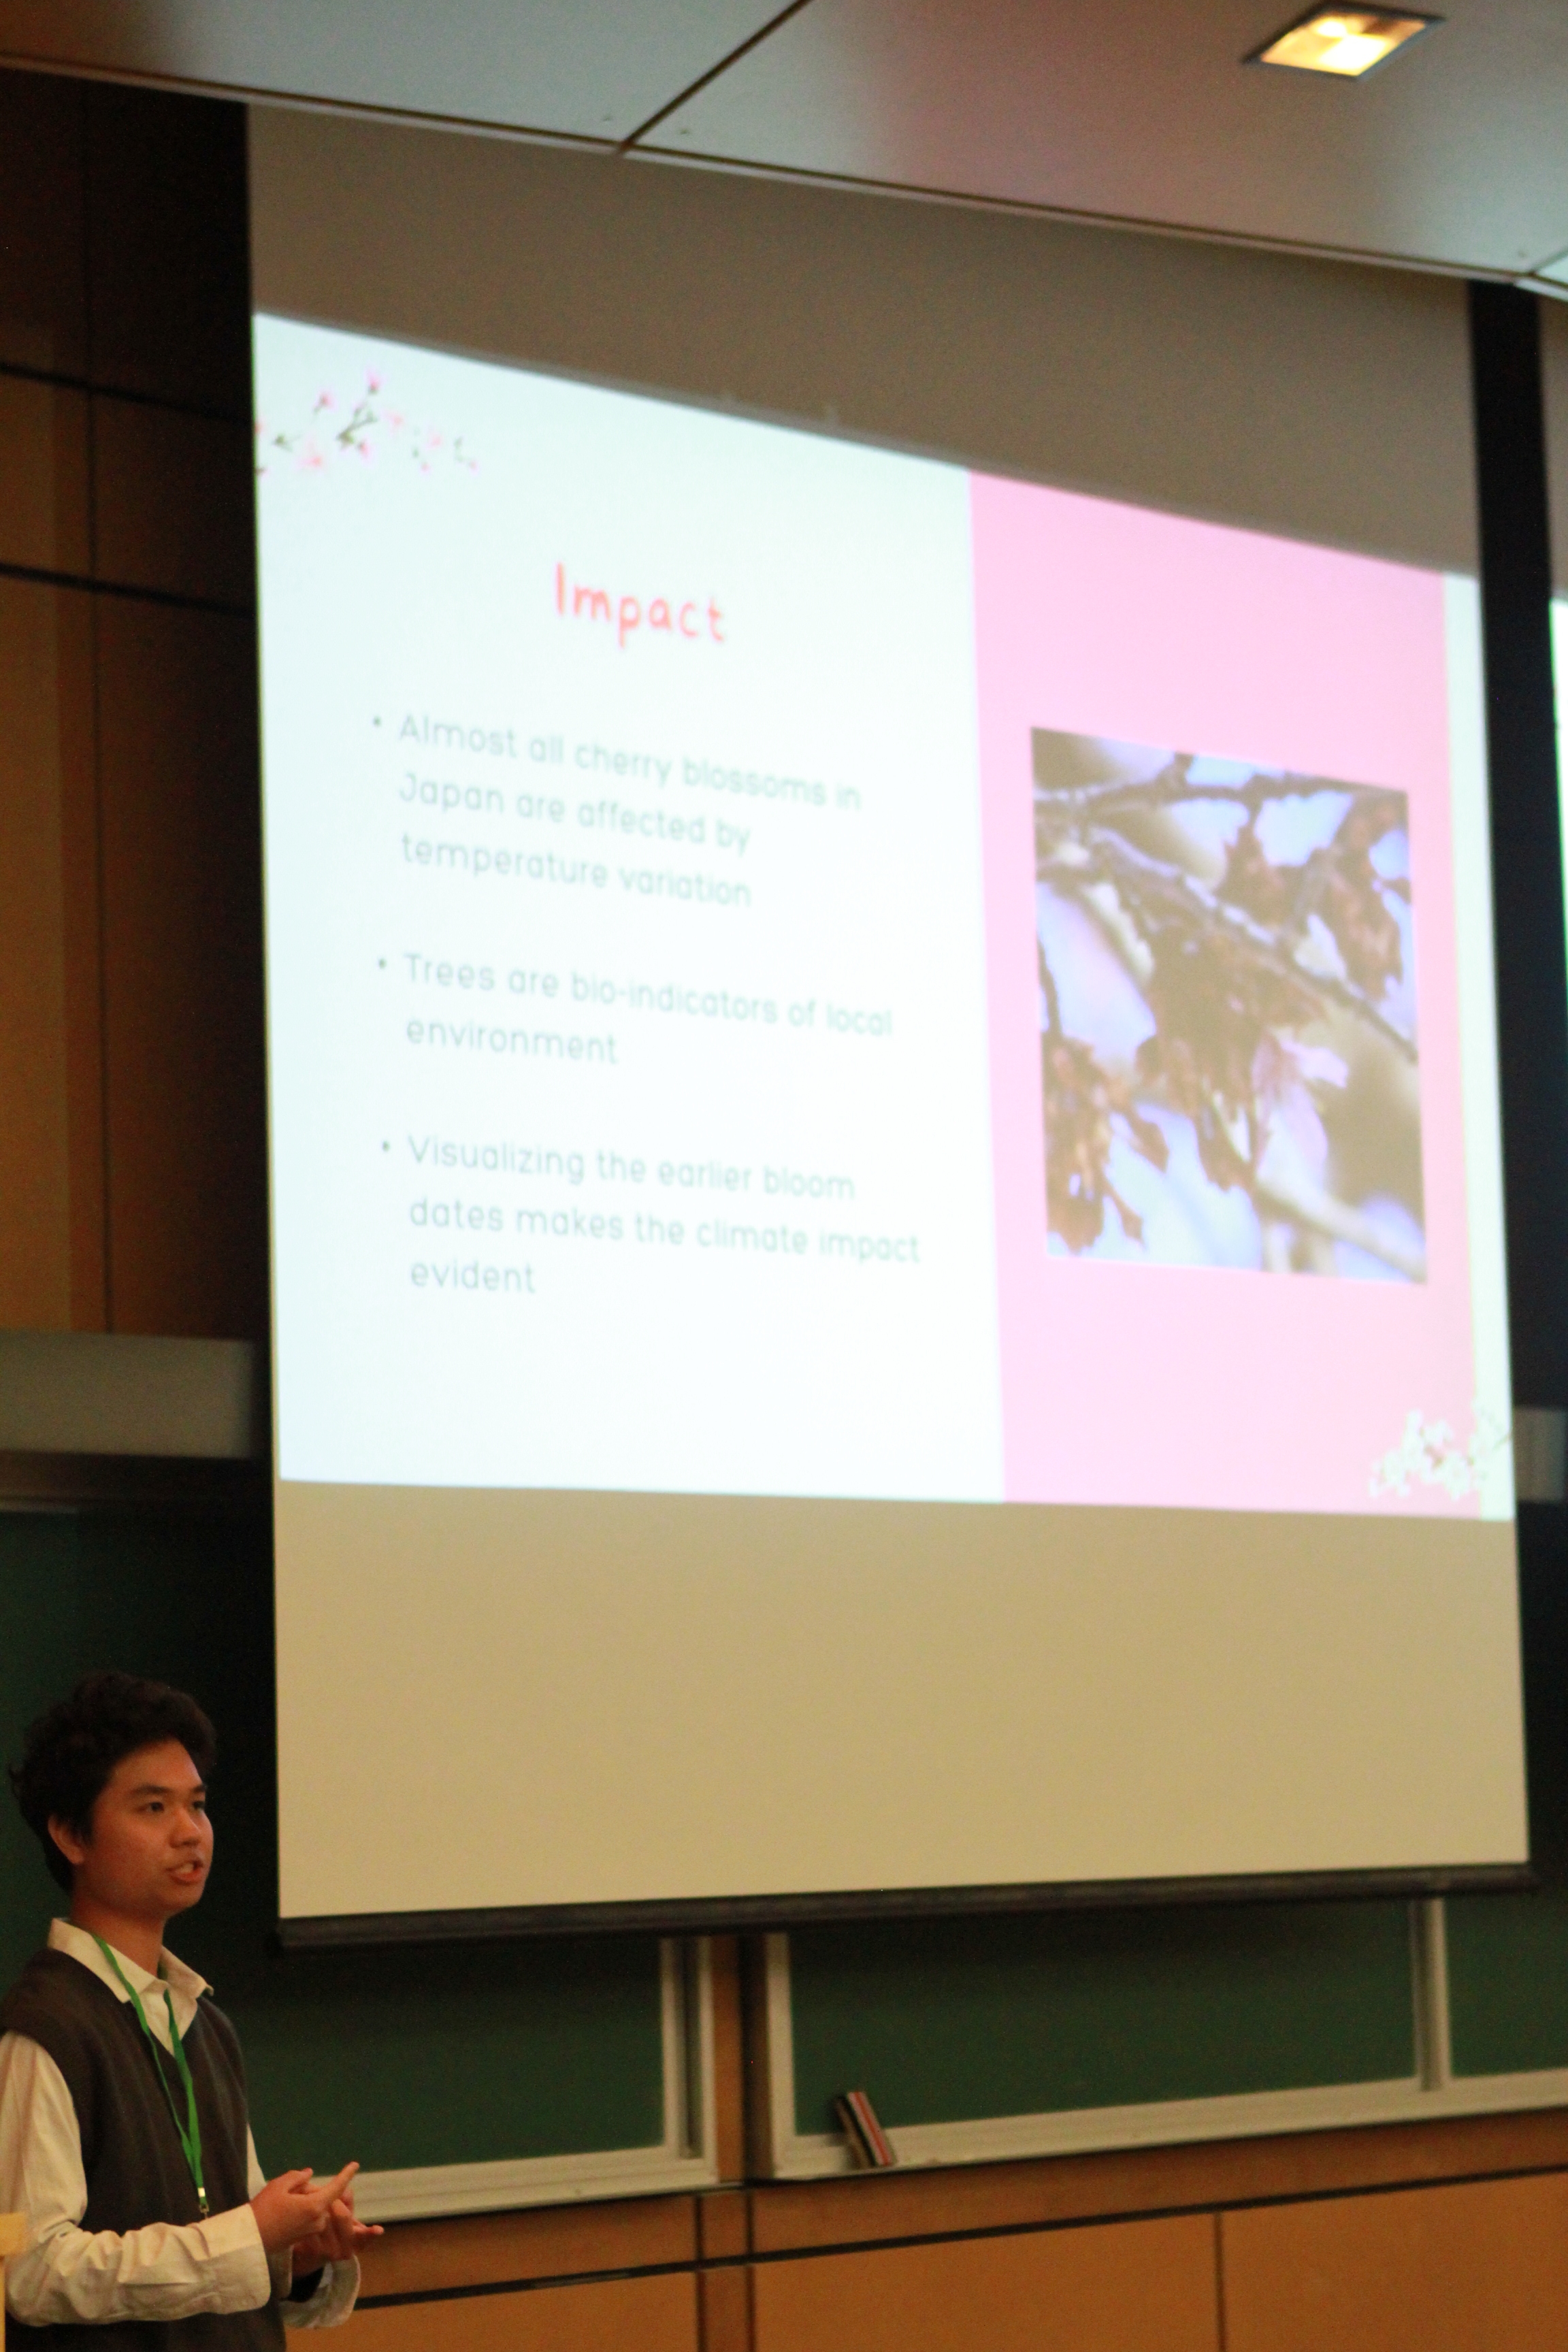
Beyond tourism, bloom timing also acts as a biological sensor for environmental change. Shifts in the time of full blooming can reflect variations in temperature, precipitation, and CO₂ emissions, serving as indicators of climate change.
Our goal is twofold:
- Help travelers find the best times to visit Japan for cherry blossoms
- Investigate how environmental factors influence bloom timing and plant health
Solution
Our approach models bloom timing as a regression problem, where the target variable is the week of the year (1–52) in which sakura reach full bloom. We trained and compared multiple models, including:
- Linear Regression
- Polynomial Regression
- random forest
- Neural Networks
- Random Forest Regression (best performing model) [2]
To make the model accessible, we developed a simple web interface where users can:
- Select a city in Japan
- Input or retireve relevant climate features
- View the predicted bloom week
This allows travelers and researchers to explore how climate conditions influence bloom timing in an intuitive way.
Methodology
We used OpenEarthData API [3] to collect environmental data for Japan, spanning 1981 to the present day, including:
- Monthly mean temperature (in Degrees Celcius):
M2SMNXSLV - Number of days with rainfall >= 1mm per month:
M2SMNXEDI
For each year X, we gathered data from November (X) to March (X + 1) to capture both:
- Spring forcing temperature – drives the onset of blooming
Winter chill requirement – ensures plants are ready for spring growth
We used data from the Japan Meteorological Agency (JMA) for the historic Full bloom week records and site data.
We then constructed seasonal tables and visualizations to identify long-term climate patterns and their correlation with cherry blossom timing, guided by plant phenology research [4].
Future Applications
- Monitoring other climate phenomenom with predictions, such as CO2 emission, N2 desposition, and photoperiod
- Scaling the model to other regions and plant species accross the globe
- Providing tourism recommendations based on real-time environmental data